Building a SOC Lab with Splunk for SIEM & Log Management
This post documents a real project I built with my teammates Prashanth Neelam and Shiva Togari as part of our B.Tech in Computer Science & Engineering (Cyber Security) at JNTUH. The goal was simple: build a working Security Operations Center from scratch, using Splunk as the SIEM, and actually simulate attacks to test whether our detection rules fire.
Not a tutorial. Not a walkthrough of someone else’s setup. This is what we actually built, broke, fixed, and learned from.
What We Set Out to Do
Most cyber courses teach you how attacks work. This project was about the other side — the defenders’ side. We wanted to:
- Collect logs from real machines (Windows and Linux) in real time
- Build dashboards that surface suspicious activity at a glance
- Write detection rules that trigger on actual attack patterns
- Simulate attacks using Kali Linux and confirm we could catch them
The project ran on Splunk Enterprise (free version), with Universal Forwarders shipping logs from a Windows client and an Ubuntu server into a central indexer.
Architecture
The setup follows a hub-and-spoke model. Every endpoint runs a Universal Forwarder that sends logs over port 9997 to the central Splunk instance, which handles indexing, searching, and dashboards.
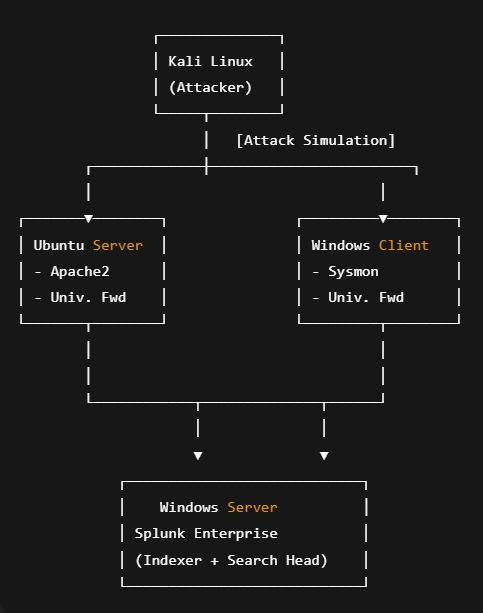
Kali Linux acts purely as the attacker — running Hydra, Nikto, and Burp Suite to simulate real threats.
Ubuntu runs an Apache2 web server and generates access and error logs.
Windows Client runs Sysmon for deep endpoint telemetry.
Splunk Enterprise (Windows) is the central brain — it ingests, indexes, and serves dashboards.
Tools & Technologies
| Component | Purpose |
|---|---|
| Splunk Enterprise (Free) | Central SIEM — indexing, search, dashboards |
| Splunk Universal Forwarder | Log collection agent on each endpoint |
| Ubuntu Server 20.04 + Apache2 | Web server, generates access/error logs |
| Windows 11 + Sysmon | Endpoint telemetry — process, network, file events |
| Kali Linux | Attack simulation (Hydra, Nikto, Burp Suite) |
| SPL (Search Processing Language) | All queries and detection logic |
| Python / PowerShell / Bash | Scripting and automation |
Environment Setup
Splunk Enterprise (Windows)
Hardware we used:
- CPU: 4+ cores
- RAM: 8+ GB
- Storage: 100+ GB for indexes
After installing Splunk and setting up the free license, the key step is enabling the receiving port:
Settings → Forwarding and Receiving → Configure Receiving → Add port 9997
Then open the firewall:
netsh advfirewall firewall add rule name="Splunk Forwarder" dir=in action=allow protocol=TCP localport=9997
netsh advfirewall firewall add rule name="Splunk Web" dir=in action=allow protocol=TCP localport=8000
netsh advfirewall firewall add rule name="Splunk Management" dir=in action=allow protocol=TCP localport=8089
Ubuntu Server
Install Apache and the Splunk Universal Forwarder:
1
2
3
4
5
6
sudo apt update && sudo apt install apache2 -y
sudo systemctl enable apache2 && sudo systemctl start apache2

wget -O splunkforwarder.tgz "https://download.splunk.com/..."
sudo tar -xzf splunkforwarder.tgz -C /opt/
sudo /opt/splunkforwarder/bin/splunk start --accept-license
Also open the ports UFW needs:
1
2
3
4
sudo ufw allow 22/tcp
sudo ufw allow 80/tcp
sudo ufw allow 8089/tcp
sudo ufw enable
Windows Client (Sysmon)
sysmon.exe -accepteula -i sysmonconfig.xml
We used a community-maintained Sysmon config (based on SwiftOnSecurity’s ruleset) to get solid telemetry without drowning the indexer in noise.
Configuration Files
inputs.conf — Ubuntu Forwarder
1
2
3
4
5
6
7
8
9
10
11
12
13
14
15
16
17
18
19
20
21
22
[default]
host = ubuntu-server

[monitor:///var/log/apache2/access.log]
disabled = false
sourcetype = apache_access
index = web_logs

[monitor:///var/log/apache2/error.log]
disabled = false
sourcetype = apache_error
index = web_logs

[monitor:///var/log/auth.log]
disabled = false
sourcetype = linux_auth
index = system_logs

[monitor:///var/log/syslog]
disabled = false
sourcetype = linux_syslog
index = system_logs
outputs.conf — Ubuntu Forwarder
1
2
3
4
5
6
7
[tcpout]
defaultGroup = default-autolb-group

[tcpout:default-autolb-group]
server = <SPLUNK_ENTERPRISE_IP>:9997
useACK = true
compressed = true
inputs.conf — Windows Forwarder
1
2
3
4
5
6
7
8
9
10
11
12
13
14
15
16
17
18
19
20
21
[default]
host = windows-client

[WinEventLog:Security]
disabled = false
start_from = oldest
evt_resolve_ad_obj = true
checkpointinterval = 5
index = windows_security

[WinEventLog:System]
disabled = false
start_from = oldest
checkpointinterval = 5
index = windows_system

[WinEventLog:Microsoft-Windows-Sysmon/Operational]
disabled = false
start_from = oldest
renderXml = true
index = sysmon
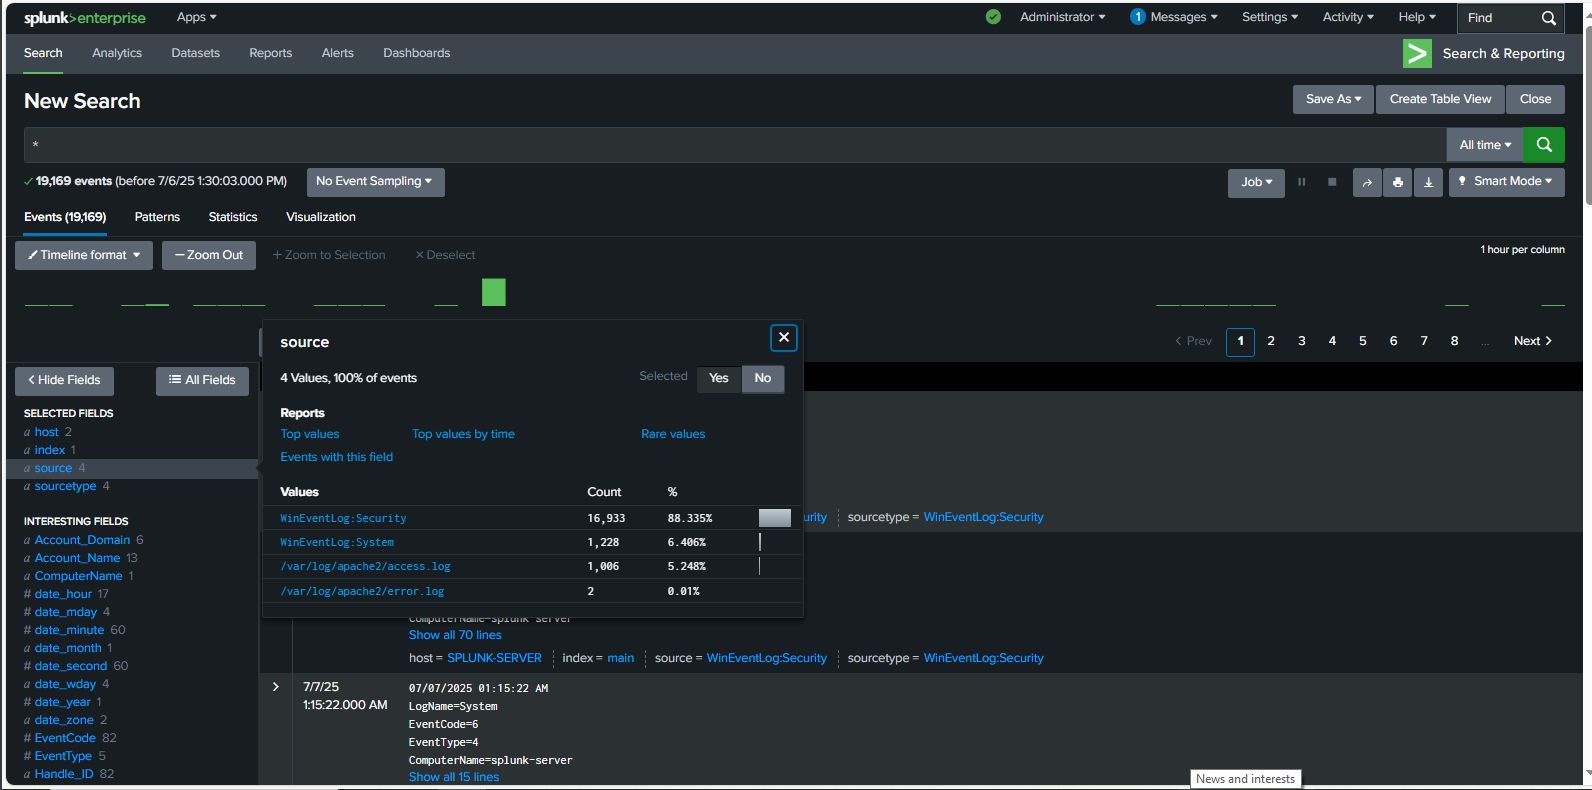
Log Sources
We collected from four main sources:
Apache Logs (Ubuntu) — access.log captures every HTTP request (IP, status code, user agent). error.log captures auth failures and server errors. This is where brute-force attempts surface first.
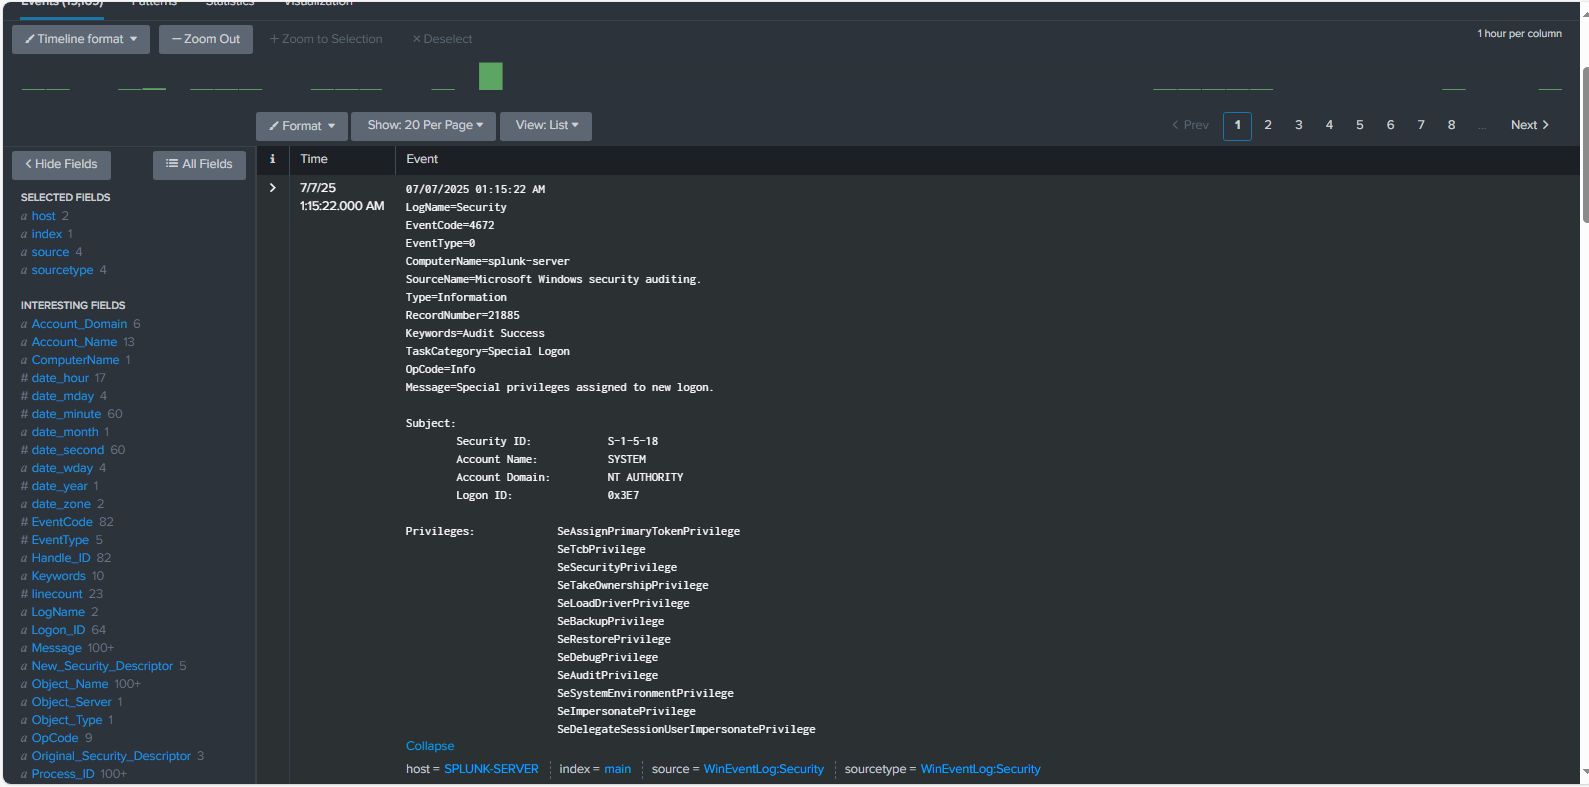
Windows Event Logs — Security log covers logins (EventCode 4624/4625), privilege changes, account creation. System log covers service starts/stops and system-level changes.
Sysmon Logs — Process creation, network connections, file writes, registry changes. This is the gold standard for endpoint visibility. Without Sysmon, half the attack chain is invisible.
Linux auth.log — SSH login attempts, sudo usage, PAM failures on the Ubuntu box.
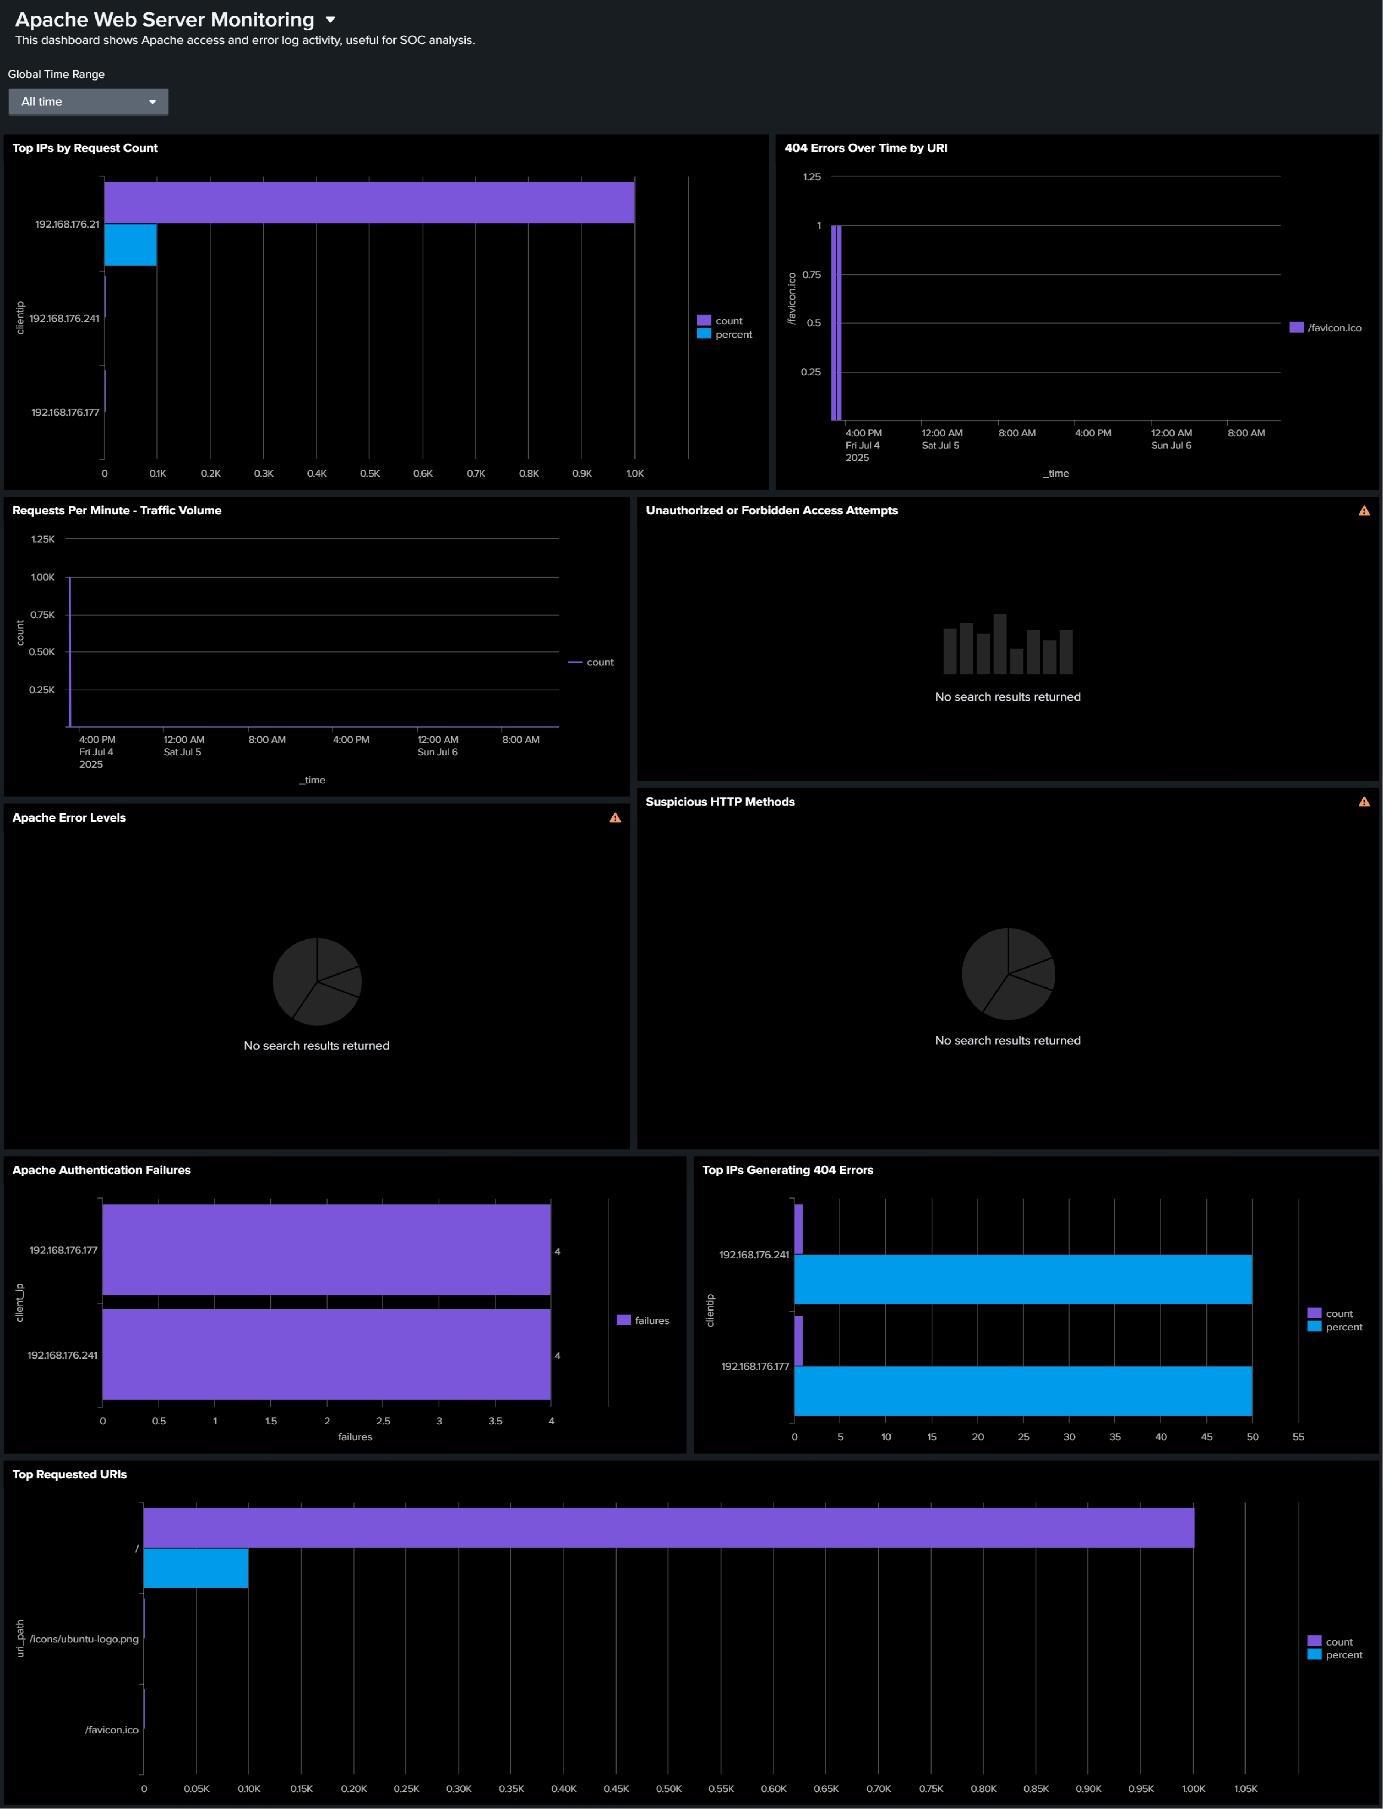
Dashboards
We built 7 dashboards in Splunk Dashboard Studio, all sharing a global time filter and refreshing in real time.
Top IPs by Request Count — Bar chart of the most active source IPs. Scanners stand out immediately.
index=web_logs sourcetype=apache_access
| stats count by clientip
| sort -count
| head 10
404 Errors by URI — Tracks requests for non-existent resources, which is a classic indicator of directory enumeration.
index=web_logs sourcetype=apache_access status=404
| stats count by uri
| sort -count
| head 20
Suspicious HTTP Methods — Pie chart of method distribution. Anything outside GET/POST on a simple web server is worth investigating.
index=web_logs sourcetype=apache_access
| stats count by method
| sort -count
Apache Authentication Failures — Timechart of auth failures grouped by source IP. The brute-force spike is unmistakable.
index=web_logs sourcetype=apache_error "authentication failure"
| timechart count by clientip
The remaining three dashboards cover real-time traffic volume, unauthorized/forbidden access attempts, and error-level distribution across the Apache logs.
Detection Rules (SPL)
Brute-Force Attack Detection
Identifies IPs hammering authentication with more than 10 failures:
index=web_logs sourcetype=apache_error "authentication failure"
| rex field=_raw "(?P<attacking_ip>\d+\.\d+\.\d+\.\d+)"
| stats count by attacking_ip
| where count > 10
| sort -count
Suspicious User Agent Analysis
Flags rare or scanner-like user agents:
index=web_logs sourcetype=apache_access
| rex field=_raw "\"(?P<user_agent>[^\"]*)\"$"
| stats count by user_agent
| where count < 5 OR match(user_agent, "(?i)bot|crawler|scanner")
| sort -count
Windows Failed Logon Analysis (EventCode 4625)
Catches repeated failed Windows logins from the same source:
index=windows_security EventCode=4625
| stats count by Account_Name, Source_Network_Address
| where count > 5
| sort -count
Attack Simulations & Results
We ran three attack scenarios from Kali Linux and verified detection in Splunk each time.
Brute-Force via Hydra
1
hydra -l admin -P /usr/share/wordlists/rockyou.txt <target_ip> http-get /admin
Result: Auth failures appeared in Apache’s error.log within seconds. The dashboard showed a clear spike. The SPL brute-force query identified the attacking IP in under 2 minutes.
Directory Traversal with curl
1
2
curl "http://<target_ip>/../../../../etc/passwd"
curl "http://<target_ip>/../../../Windows/system32/config/sam"
Result: Logged as 400/403 responses in access.log. The 404-by-URI dashboard flagged the suspicious paths immediately.
Web Scanning with Nikto
1
nikto -h <target_ip> -p 80
Result: Generated a burst of unusual URIs and HTTP methods. The Suspicious HTTP Methods and Top IPs dashboards both lit up within 1-2 minutes.
Detection summary:
- Attack detection rate: 100% for all simulated scenarios
- Mean time to detection: ~1.5 minutes for brute-force attempts
- False positive rate: <2% after tuning thresholds
Challenges We Hit
Firewall blocking port 9997 — Forwarders couldn’t reach the indexer until we explicitly opened the port on both ends. Learned to always test connectivity with telnet <ip> 9997 before debugging anything else.
Regex extracting IPs with port numbers — Our initial client IP extraction pattern was pulling 192.168.1.x:PORT instead of just the IP. Fixed by tightening the regex pattern and validating it in Splunk’s built-in regex tester.
Dashboard visualizations showing no data — Turned out to be wrong index names in SPL queries and time ranges not matching the actual data timestamps. Always verify the index exists and has data with index=<name> | head 5 first.
Index corruption after a hard shutdown — We lost a testing session when the VM was killed mid-index. Had to run Splunk’s fsck command and rebuild the affected index from raw data. Lesson: always shut Splunk down gracefully.
Results
Over the testing period, the pipeline ingested approximately 350MB/day:
- Apache logs: ~50MB/day
- Windows Event Logs: ~200MB/day
- Sysmon logs: ~100MB/day
Search performance: average response under 3 seconds for common queries, dashboards loading in under 5 seconds.
Top security event categories observed:
- Failed authentication attempts — 45% of security events
- Suspicious HTTP methods — 25%
- 404 errors indicating reconnaissance — 20%
- Large file transfers — 10%
What’s Next
A few things on the roadmap from here:
- Automated alerting — Configure email/webhook notifications for high-severity rules so detections don’t require someone watching a dashboard
- MITRE ATT&CK mapping — Tag each detection rule with the corresponding technique ID (T1110 for brute force, T1046 for network scanning, etc.)
- Machine learning via Splunk MLTK — Anomaly detection on traffic baselines to catch things rule-based detection misses
- Extended log sources — Firewall logs, DNS query logs, database audit logs
- Compliance dashboards — PCI-DSS and SOC 2 reporting templates
Takeaways
If I had to compress what we actually learned into a few points:
Getting data in is the easy part. Getting signal out of noise is the real work. Our first detection rules fired constantly on benign activity until we spent time tuning thresholds and time windows.
Sysmon is non-negotiable for Windows. Native Windows Event Logs leave massive blind spots. Process creation, network connections, and registry changes from Sysmon revealed the full picture of what our simulated attacks were actually doing.
Test your detections. A rule that doesn’t fire on a known attack is worse than having no rule — it creates false confidence. Running actual Hydra and Nikto scans against the lab and watching the dashboards respond is what made this real.
This project was completed as part of the B.Tech in Computer Science & Engineering (Cyber Security) at JNTUH University College of Engineering, Science & Technology Hyderabad, under the guidance of Ms. Praveena N.
Source code and configuration files: github.com/arvdch/home_soc_with_splunk